Why this data matters
Every number on this dashboard has a direct impact on the health and wellbeing of everyone on campus.
.jpg)
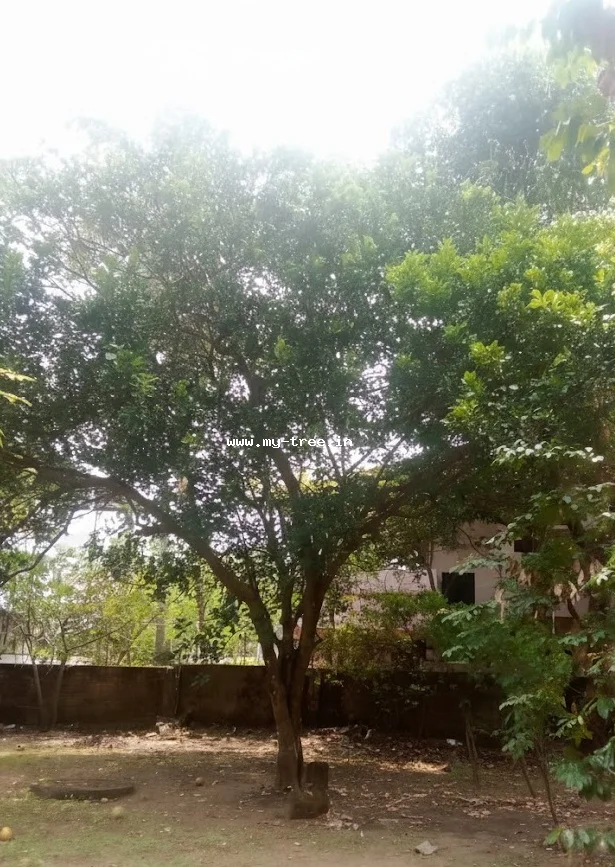
.png) One Library Per Village
One Library Per Village
Campus Air Health Dashboard & Green Forest Monitor · Official Site ↗
Real-time ecological intelligence · One Library Per Village
Why this data matters
Every number on this dashboard has a direct impact on the health and wellbeing of everyone on campus.
PM2.5 — Fine Particles
Particles smaller than 2.5 microns penetrate deep into lungs and bloodstream. High PM2.5 is linked to respiratory disease, heart conditions, and reduced cognitive performance in students.
NO₂ — Nitrogen Dioxide
Emitted by vehicles and generators near campus. NO₂ irritates airways, worsens asthma, and reduces lung capacity — especially harmful during outdoor sports and field activities.
UV Index — Solar Radiation
Guides when sunscreen is needed and when outdoor activities should be limited. Consistent UV exposure without protection raises long-term risk of skin damage and vision issues.
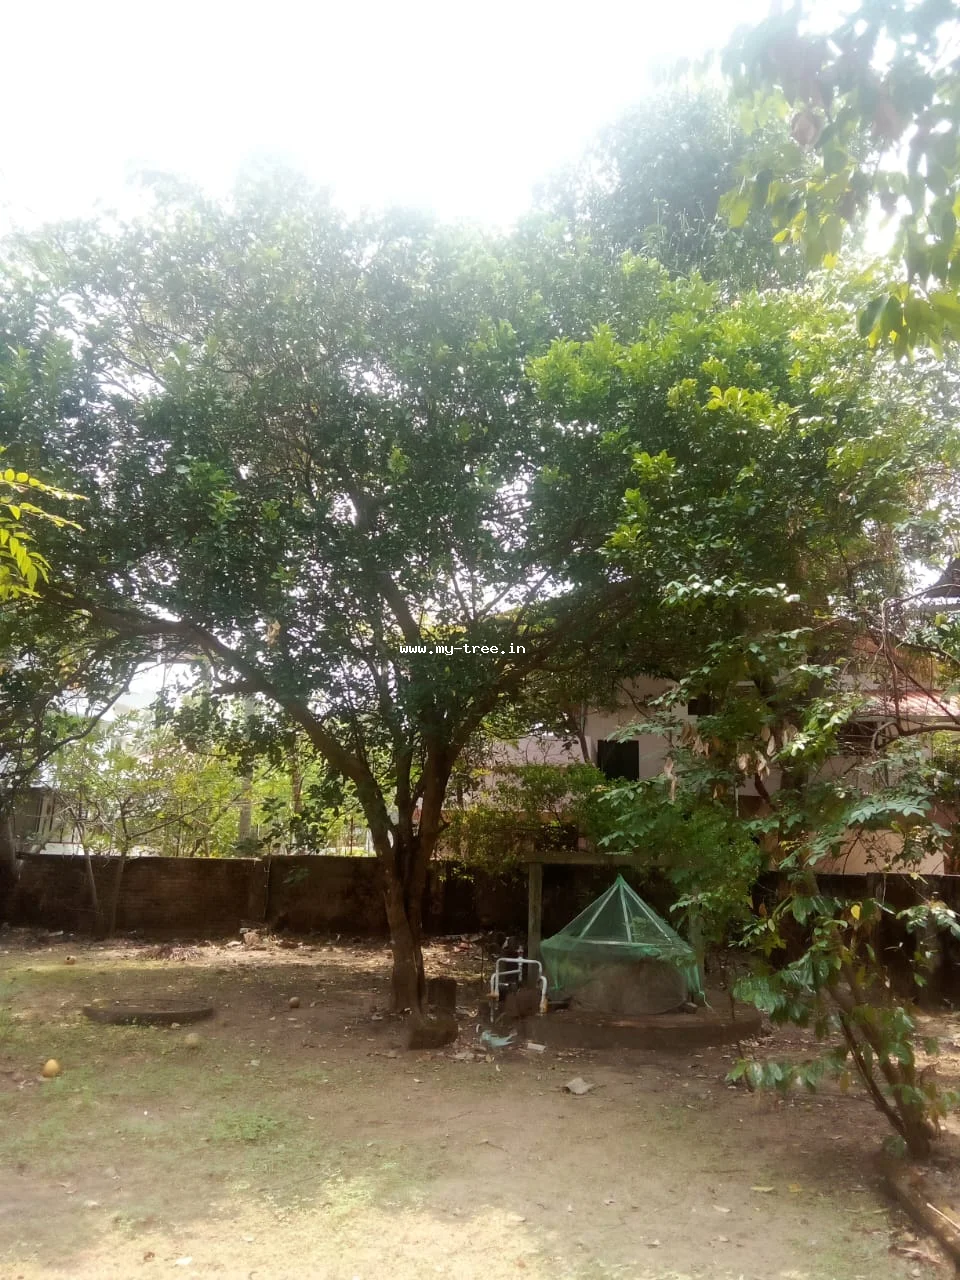
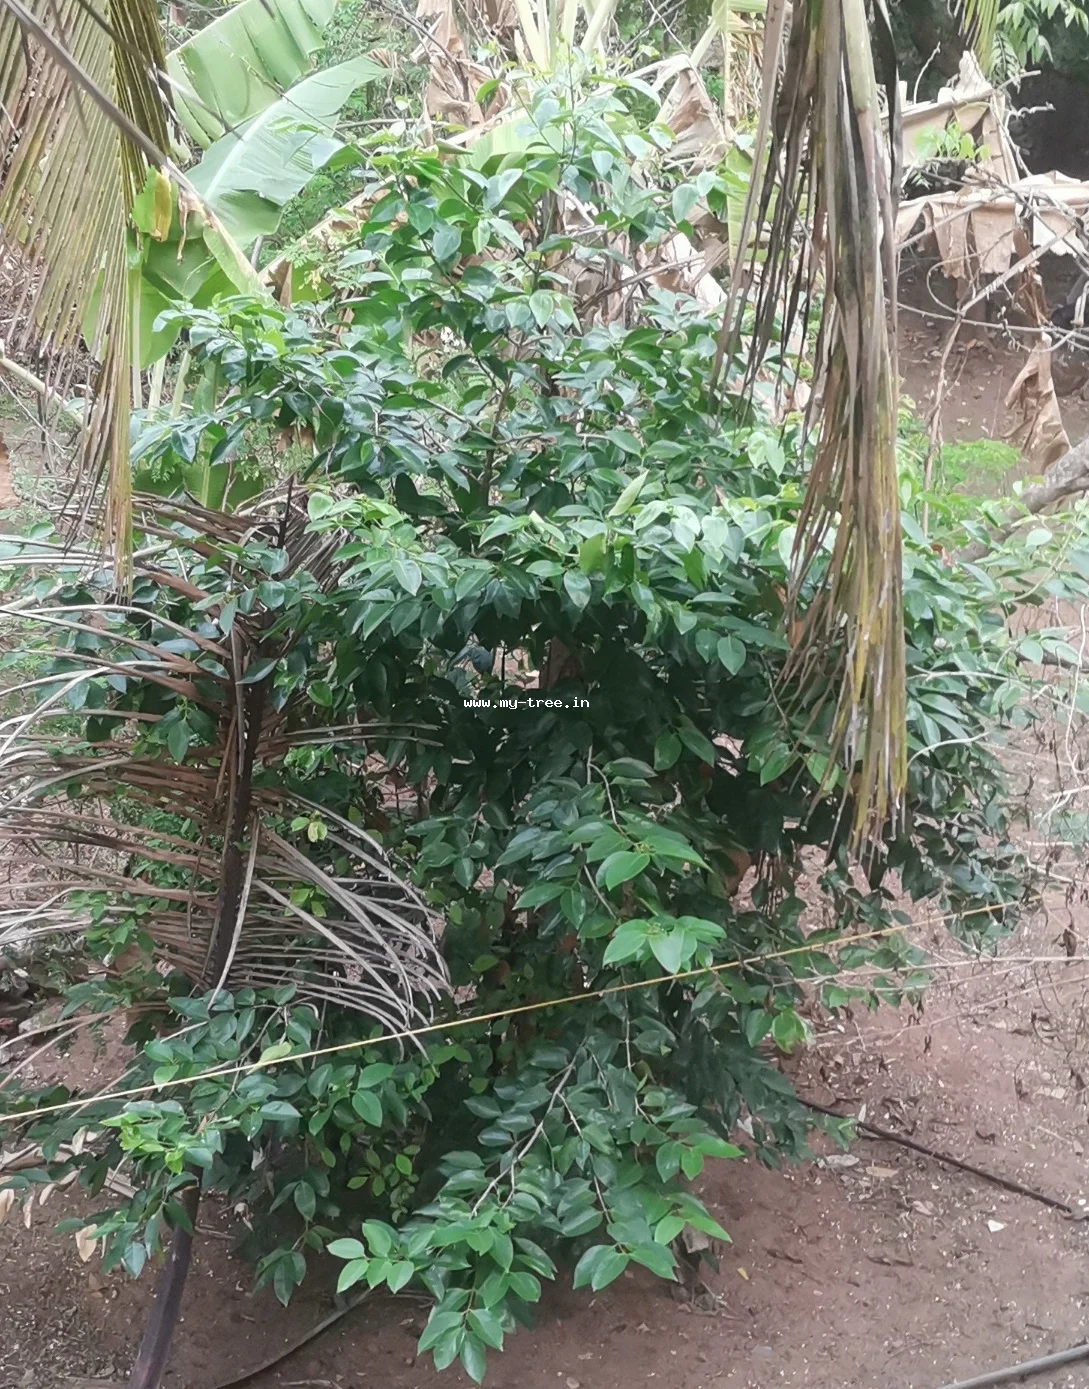
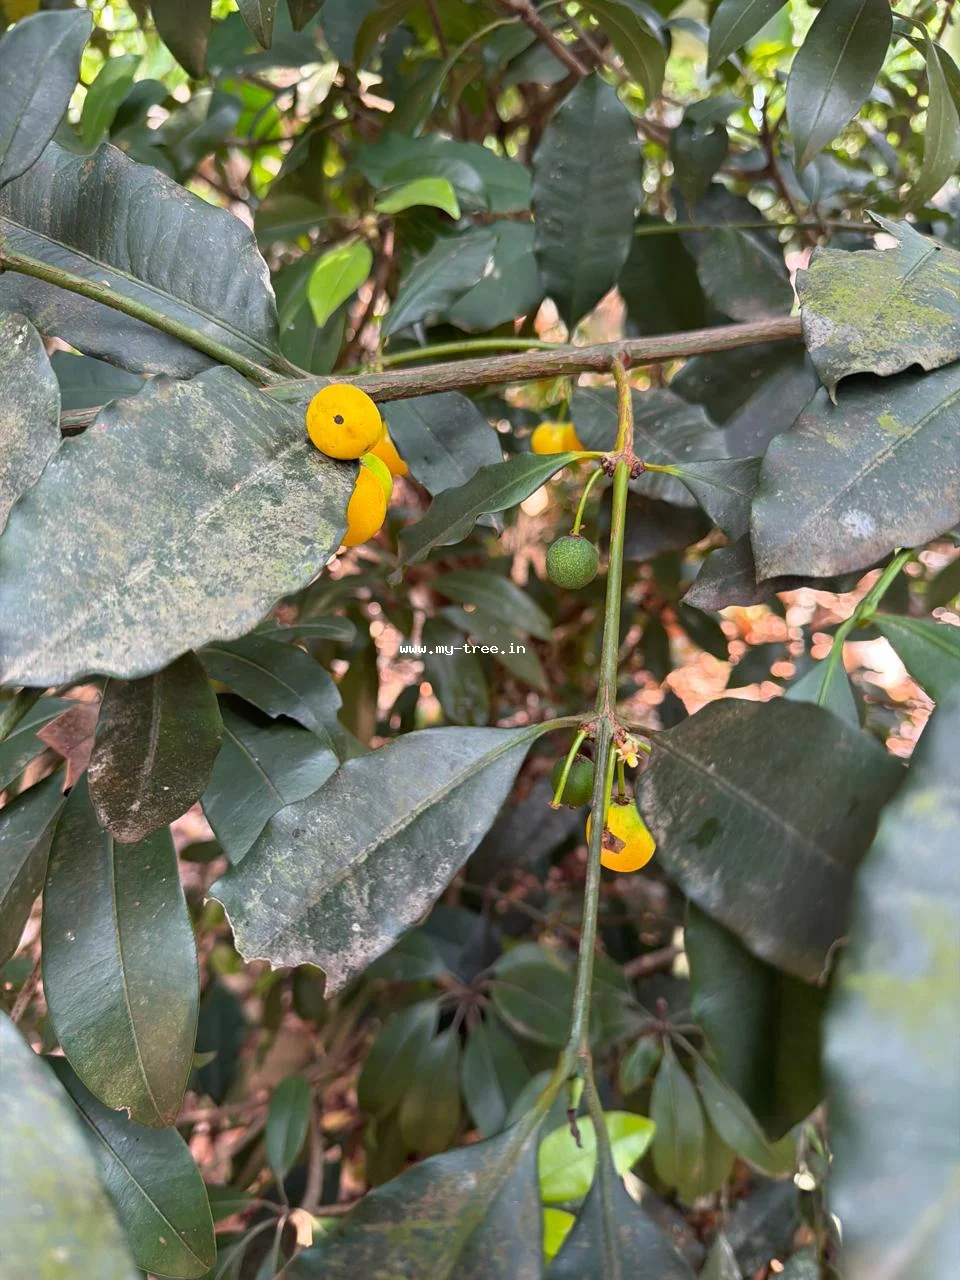
Campus Trees — Your Green Shield
Each registered tree actively absorbs CO₂, filters air pollutants, reduces surface temperature by up to 8°C, and provides a measurable health dividend to every person on campus.
PM2.5 (μg/m³)
--
NO₂ (μg/m³)
--
O₃ Ozone (μg/m³)
--
CO₂ Estimate (ppm)
418
Temperature
Humidity
Wind km/h
AQI Status
UV Radiation Index
Sunscreen recommended when UV > 5
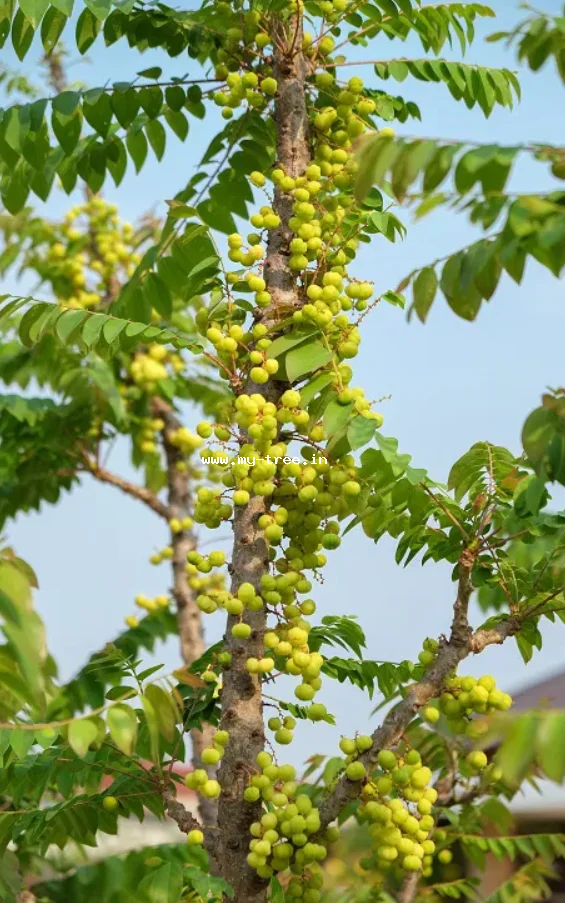
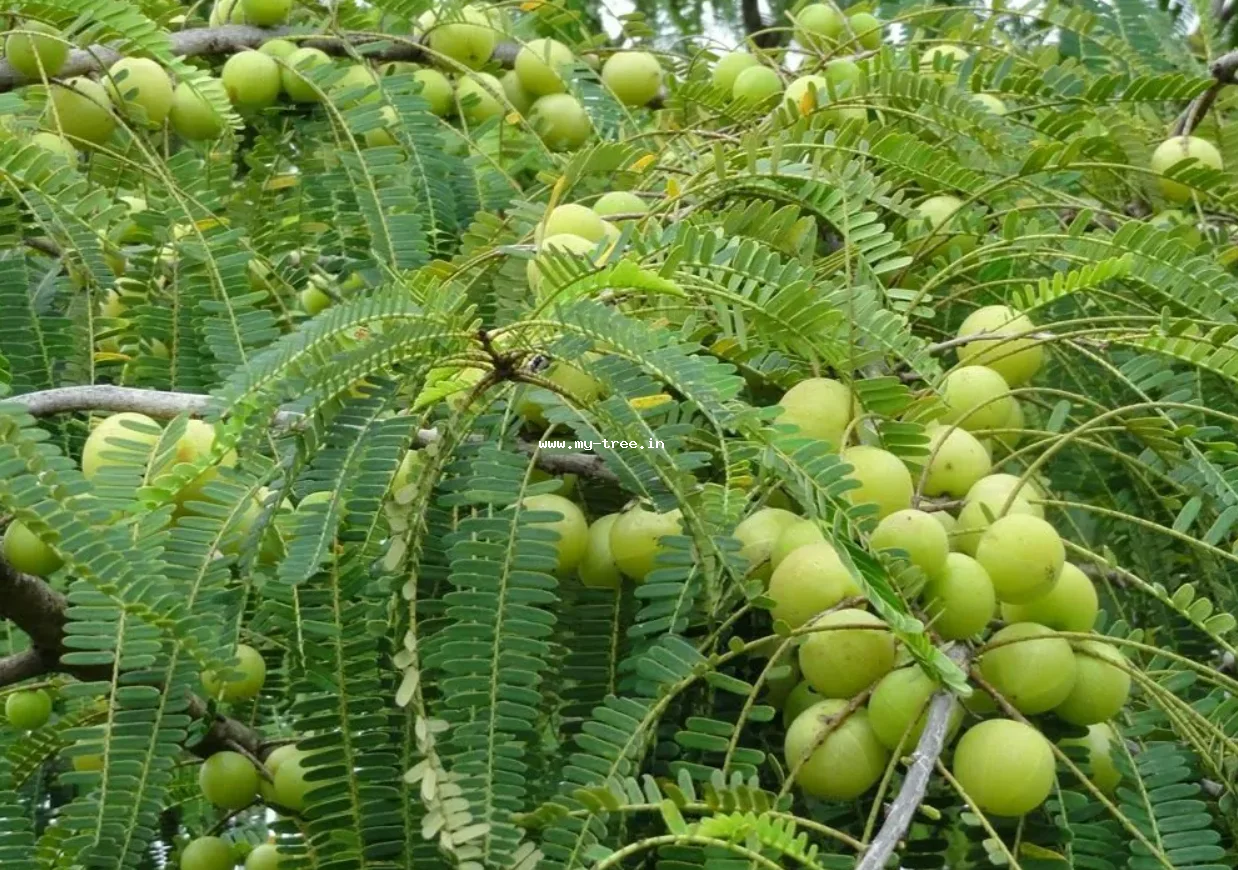
Every tree you tag is monitored, measured and contributes to verified green credits for One Library Per Village .